W2ETI Data Acquisition and Monitoring
Of course a beacon must be operated automatically and by remote control.
One can hardly hover over it 12 hours per day! To meet ones commitment to
the SETI and EME communities, and ones obligation to the FCC, it is necessary to
be sure that it is functioning correctly at all times. This is
accomplished by instrumenting the beacon and confirming that all readings are as
expected. Every minute, the computer measures power supply voltages and
currents, forward and reverse power, and frequency error. Periodically, a
complete calibration is performed using a spectrum analyzer to measure
interstage power and check for signal purity over a number of spans, ranging
from +/- 200MHz to look for out-of-band spurious signals, to +/- 10kHz, to
confirm signal purity and to make sure nothing has gone awry with the
synthesizer or power supplies that doesn't show up in the other measurements.
The results of these measurements are logged and archived in case a problem
is discovered or reported. In addition, a
status report is generated and put on the web so users can confirm the
beacon is operational and check the power level.
| |
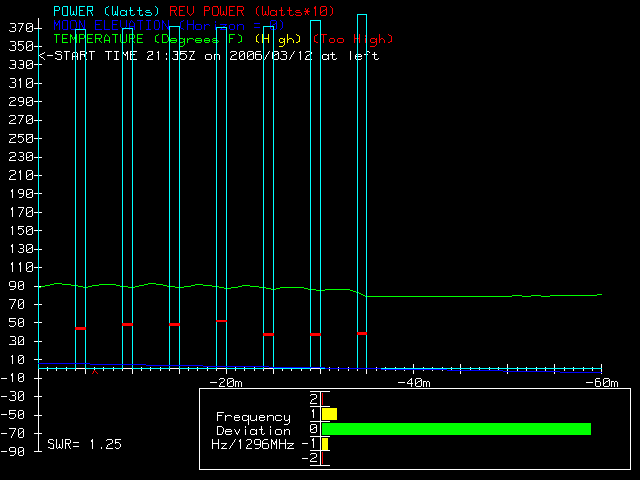
W2ETI Realtime Status Display Sample |
|
| The left vertical axis is calibrated from -90 to 370. These
numbers encompass several parameters: The elevation of the moon
above (or below) the horizon (-90 to +90 degrees), the power output of
the beacon, and the temperature of the amplifier, typically 60 to 120
degrees F. |
 |
The little red horizontal bars in the power histogram
represent reflected power multiplied by ten.
This graph shows beacon
operation at moonrise. |
| At the lower left, the SWR of the most recent transmission is
calculated . |
The horizontal axis represents one hour, with the
present time at the left. This mimics a "strip chart" presentation
rather than a graph where time would be increasing to the right.
Inset below the horizontal axis is the frequency deviation histogram.
A frequency measurement is made each minute and the deviation from
1296.000000MHz is recorded in Hz. If, for example, the frequency
was 1/2 Hz high, one would expect to see a green bar about half as long
as the one in the example, and a yellow bar of similar length above it.
Each 1Hz deviation represents an error of less than 1 part in 109. |
|
